TL;DR
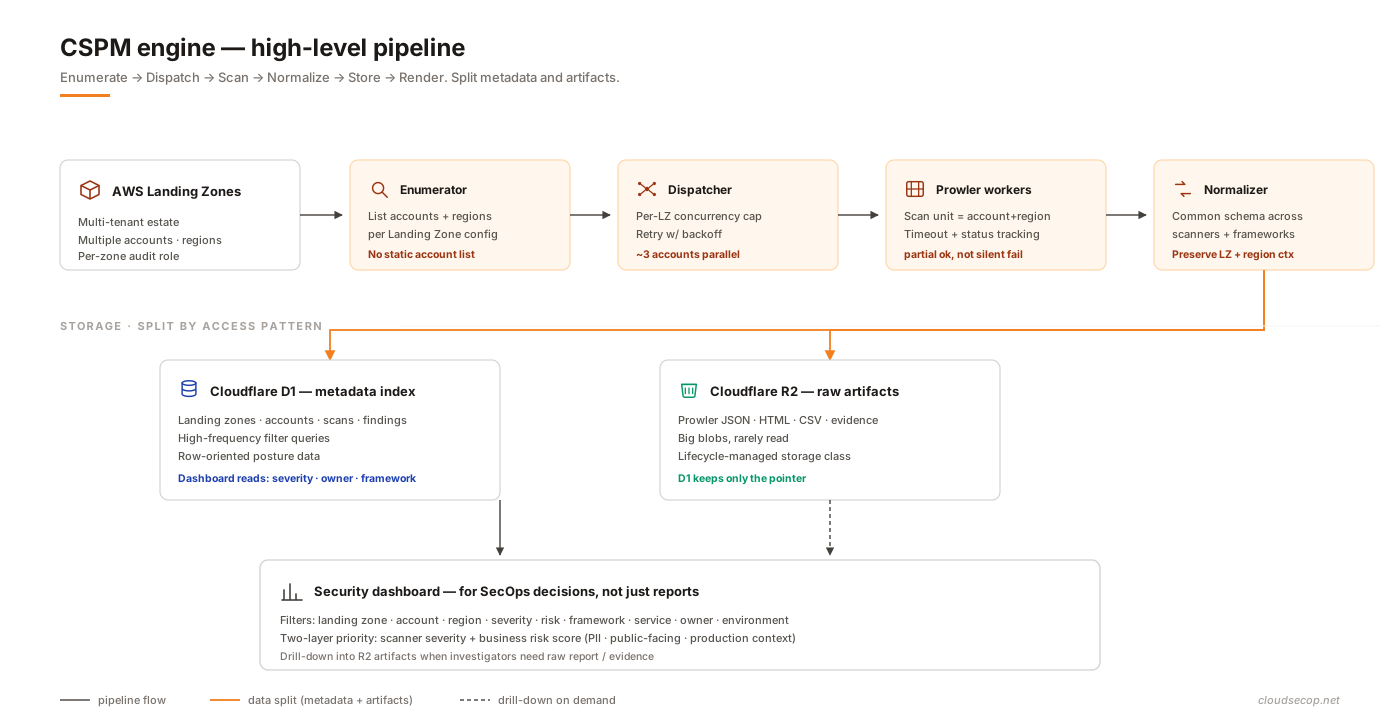
- enumerate → dispatch → scan → normalize pipeline with Prowler as scanner, D1 for metadata index, R2 for raw artifacts (JSON, HTML reports, screenshots).
- Landing Zone is the primary unit, not the individual account — each LZ owns its audit role, region scope, SLA, owning team.
- Cap at ~3 concurrent accounts per Landing Zone: 10-way parallel triggered AWS
ThrottlingException; dropping to 3 traded a bit of speed for reliable data.- Don’t dedupe too early — collapsing on
finding_idhides the same misconfig in another region; the dedup key must becloud_provider + landing_zone_id + account_id + region + service + resource_id + control_id.- Severity ≠ risk: the same “Critical public S3 bucket” can be Low (static CSS) or Critical (customer export with PII) — enrich findings with business context.
- Most useful view is “Critical/High on production, public-facing, sensitive data, open >7 days, no owner” — not “all critical findings”.
- Engine refreshes the account list every 15 minutes; the next direction is event-driven from AWS Organizations for near-real-time detection of new accounts/regions.
When an AWS footprint is small, assessing security posture is relatively simple: open the AWS Console, check a few important services, run some AWS CLI commands, or use a tool like Prowler to export a report.
But once an organisation runs dozens of AWS accounts, split into multiple Landing Zones by business unit, environment, region, and owning team, the problem is no longer “scan an account”.
The real question becomes:
How do we know what the overall AWS posture looks like, which account is the riskiest, which finding to fix first, and who owns remediation?
This post describes how I built an in-house CSPM engine that scans a dozen-plus AWS Landing Zones in parallel with Prowler, stores findings in Cloudflare D1, keeps artifacts in R2, and aggregates everything into a single dashboard for Security Operations.
Context
In an enterprise environment, workloads rarely sit in a single AWS account.
The AWS estate is typically organised across several dimensions:
- Landing Zones by business unit or operational domain.
- Accounts by workload, environment, or ownership.
- Regions by latency, compliance, or deployment footprint.
- Security baselines that differ between production, staging, sandbox, and shared services.
- Owners split across the cloud team, app teams, platform team, and security team.
At small scale, running CSPM can be as simple as:
prowler awsAt enterprise scale, “what does posture look like today?” quickly fragments into narrower questions:
- Which Landing Zone has the most critical findings?
- Which account drifts furthest from the baseline?
- Which findings repeat across multiple regions?
- Which resources are public-facing?
- Which findings touch sensitive data?
- Which team owns each one?
- Which findings have been open for many days without remediation?
- Which compliance framework is failing most often?
Without a consistent data shape from day one, a CSPM dashboard devolves into a dumping ground for findings — plenty of alerts, but little operational signal.
Design goals
We did not set out to build an “in-house Wiz” on day one.
The initial goals were pragmatic:
- Scan multiple AWS Landing Zones.
- Scan many accounts and regions in parallel.
- Normalise findings into a shared schema.
- Query quickly by Landing Zone, account, region, severity, framework, and owner.
- Separate metadata from artifacts to keep storage costs reasonable.
- Build a dashboard that Security Operations actually uses daily.
The critical constraint was that the system had to serve two different needs:
- Audit / compliance view: what is passing or failing which framework.
- Operational risk view: which finding to fix first given the business context.
High-level architecture
At a high level, the CSPM engine is an enumerate → dispatch → scan → normalize pipeline that splits output between D1 (metadata index) and R2 (raw artifacts). The dashboard reads D1 and drills into R2 only when an investigator needs the evidence.
1. Enumerate: define the scan scope
The first stage determines what needs to be scanned.
Instead of hard-coding AWS accounts, the engine treats the Landing Zone as the primary operational unit. Each Landing Zone may have:
- Its own SSO Start URL.
- Its own list of accounts.
- Its own audit role.
- Its own region scope.
- Its own owner.
- Its own scan schedule.
- Its own remediation SLA.
A minimal Landing Zone record:
{
  "landing_zone_id": "lz-retail-prod",
  "name": "Retail Production Landing Zone",
  "cloud": "aws",
  "sso_start_url": "https://example.awsapps.com/start",
  "audit_role_name": "SecurityAuditRole",
  "regions": ["ap-southeast-1", "us-east-1"],
  "owner": "retail-platform-team",
  "scan_enabled": true
}
From there, the engine enumerates the accounts and regions to scan. Each (account, region) pair is one scan unit:
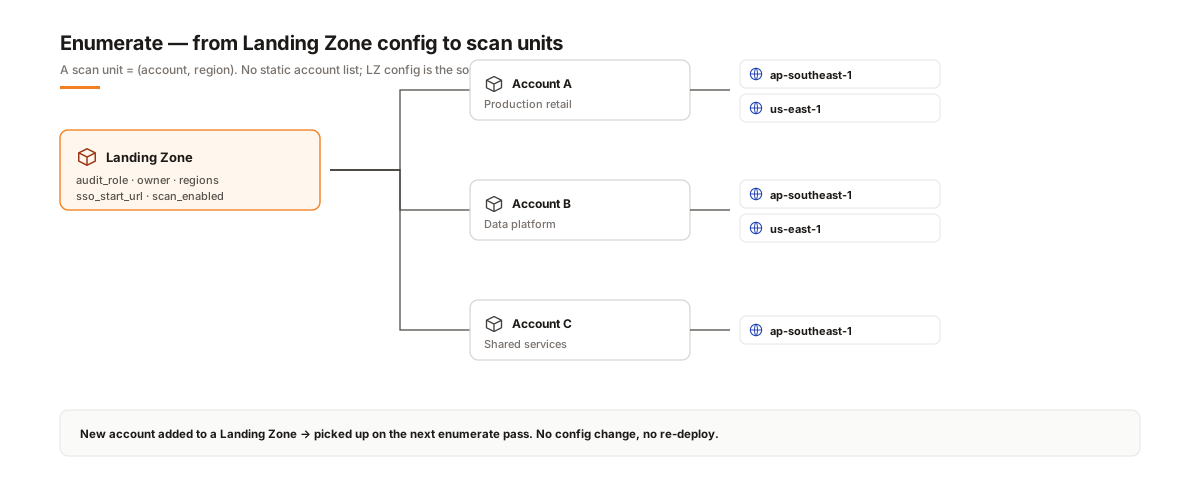
This approach avoids a static list of accounts. When a new account is added to a Landing Zone, the engine picks it up on the next refresh.
2. Dispatch: scan in parallel, but under control
A common mistake when scaling CSPM is assuming “more parallelism is always faster”.
In practice, scanning too many accounts simultaneously triggers AWS API throttling. Some service APIs have lower quotas than expected, particularly when the scanner calls many APIs across many regions.
The dispatcher is therefore designed around these constraints:
- Each account-region pair is a scan unit.
- Scans run in parallel.
- Concurrency is capped per Landing Zone.
- Retries use exponential backoff on throttling.
- Each scan job has a timeout.
- Job state is explicit: pending, running, succeeded, failed, partial.
Dispatch logic, illustrated:
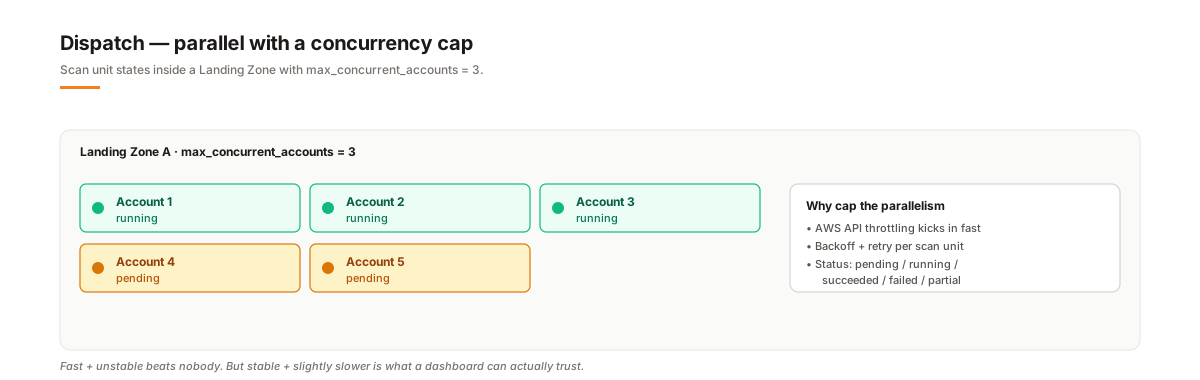
The initial version scanned 10 accounts in parallel inside the same Landing Zone. On paper it was faster, but the data became unreliable because of frequent ThrottlingException errors.
After dropping the limit to around 3 concurrent accounts per Landing Zone, overall scan time grew slightly, but stability improved significantly.
In CSPM, fast scans are good. Fast scans with untrustworthy data make the dashboard worthless.
3. Normalize: map findings into a shared schema
Prowler output is reasonably complete on its own. But aggregating findings from many accounts, regions, Landing Zones, and frameworks into a single dashboard requires a shared schema.
Findings are normalised into the following field groups:
- Identity —
finding_id,scan_id,landing_zone_id,account_id,account_name,region,cloud_provider - Resource —
resource_id,resource_type,resource_name,service - Security —
severity,status,risk_score,risk_reason,remediation - Compliance —
framework,control_id,requirement_id - Ownership —
owner_team,business_unit,environment - Time —
first_seen_at,last_seen_at,resolved_at
The important rule: do not deduplicate too early.
The first version deduplicated by finding_id. It made the dashboard cleaner, but it also stripped away important context.
The same misconfiguration can show up in multiple regions. Dedup on finding_id alone collapses them into one row and the engineer only fixes one region — the other bucket stays public. The dedup key has to carry enough context:
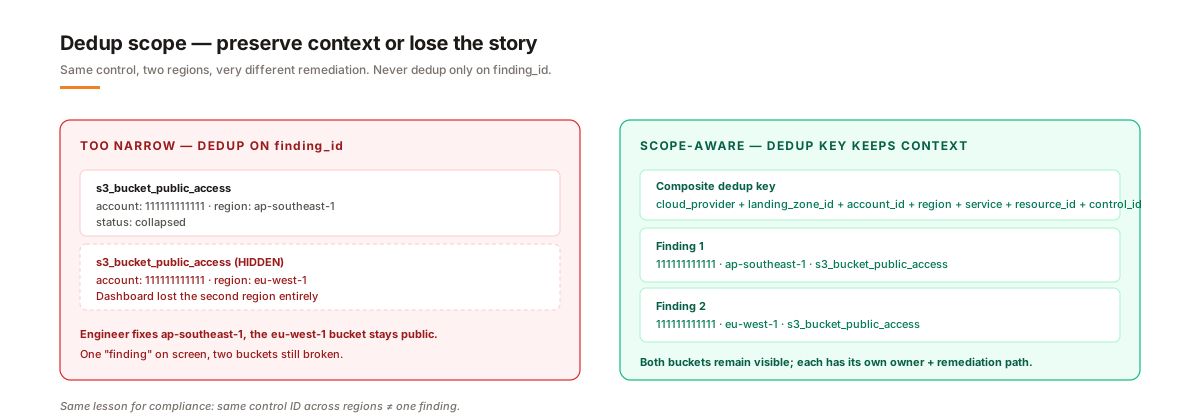
With this key, findings retain accuracy when the user drills down.
4. Render: a dashboard for Security Operations
A dashboard is not just for “looking at findings”. It has to help the security team make operational decisions.
The filters that matter:
- Landing Zone
- Account ID
- Account name
- Region
- Severity
- Risk score
- Compliance framework
- Service
- Resource type
- Owner team
- Environment
- First seen / last seen
- Remediation status
The most useful view for Security Operations is usually not “all critical findings”, but:
Critical or High findings on production accounts, public-facing resources, with sensitive data classification, open for more than 7 days, and without an assigned owner.
Two layers are kept distinct:
| Layer | Meaning |
|---|---|
| Severity | Technical severity reported by the scanner |
| Risk score | Adjusted risk level after business context is applied |
For example:
| Finding | Severity | Business context | Risk |
|---|---|---|---|
| Public S3 bucket holding static CSS | Critical | No sensitive data | Low |
| Public S3 bucket holding customer export | Critical | Contains PII / customer data | Critical |
| Security group with SSH open internally | High | Private subnet only, ZTNA in front | Medium |
| IAM user with a stale access key | Medium | Holds admin in production | Critical |
This distinction is what separates a scanner report from a CSPM dashboard that is actually usable.
Why D1 and R2
Data splits into two categories:
| Data | Location |
|---|---|
| Metadata, findings, scan status, index | Cloudflare D1 |
| Raw Prowler JSON, HTML reports, exports, screenshots | Cloudflare R2 |
D1 for metadata
Findings are row-shaped data that is queried and filtered continuously.
Typical queries include:
SELECT *
FROM findings
WHERE landing_zone_id = ?
  AND severity IN ('HIGH', 'CRITICAL')
  AND status = 'FAIL'
ORDER BY risk_score DESC, last_seen_at DESC;
D1 fits the metadata layer because:
- The data is structured.
- Queries hit many dimensions.
- The dashboard reads far more than it writes.
- No separate database has to be operated.
- It integrates cleanly with Cloudflare Workers.
R2 for artifacts
Raw scanner reports do not belong inside the database.
Artifacts such as:
- Raw Prowler JSON
- HTML reports
- CSV exports
- Evidence files
- Screenshots
- Debug logs
land in R2. D1 only keeps pointers:
{
  "scan_id": "scan_20260428_001",
  "raw_json_url": "r2://cspm-artifacts/prowler/raw/scan_20260428_001.json",
  "html_report_url": "r2://cspm-artifacts/prowler/html/scan_20260428_001.html"
}
This keeps the database small, queries fast, artifacts cheap to store, and lifecycle management straightforward.
Minimum schema
A minimum schema for the CSPM engine can start here:
CREATE TABLE landing_zones (
  id TEXT PRIMARY KEY,
  name TEXT NOT NULL,
  cloud_provider TEXT NOT NULL,
  owner_team TEXT,
  scan_enabled INTEGER DEFAULT 1,
  created_at TEXT,
  updated_at TEXT
);

CREATE TABLE cloud_accounts (
  id TEXT PRIMARY KEY,
  landing_zone_id TEXT NOT NULL,
  account_id TEXT NOT NULL,
  account_name TEXT,
  environment TEXT,
  owner_team TEXT,
  status TEXT,
  created_at TEXT,
  updated_at TEXT,
  FOREIGN KEY (landing_zone_id) REFERENCES landing_zones(id)
);

CREATE TABLE scans (
  id TEXT PRIMARY KEY,
  landing_zone_id TEXT NOT NULL,
  account_id TEXT,
  region TEXT,
  scanner TEXT NOT NULL,
  status TEXT NOT NULL,
  started_at TEXT,
  finished_at TEXT,
  artifact_url TEXT,
  error_message TEXT,
  FOREIGN KEY (landing_zone_id) REFERENCES landing_zones(id)
);

CREATE TABLE findings (
  id TEXT PRIMARY KEY,
  scan_id TEXT NOT NULL,
  landing_zone_id TEXT NOT NULL,
  account_id TEXT NOT NULL,
  region TEXT,
  service TEXT,
  resource_id TEXT,
  resource_type TEXT,
  control_id TEXT,
  title TEXT,
  severity TEXT,
  status TEXT,
  risk_score INTEGER,
  risk_reason TEXT,
  framework TEXT,
  remediation TEXT,
  owner_team TEXT,
  first_seen_at TEXT,
  last_seen_at TEXT,
  resolved_at TEXT,
  FOREIGN KEY (scan_id) REFERENCES scans(id)
);
This is not the final shape, but it is enough to support the core use cases:
- Scan tracking
- Finding inventory
- Dashboard filters
- Risk prioritisation
- Owner assignment
- Historical trending
Three lessons
1. Do not deduplicate findings too early
Deduplication cleans up the dashboard, but done wrong it strips context.
Findings must be tracked at the right scope — account + region + resource + control. Not by control name or finding ID alone.
In cloud security, the same issue on a different account, region, or resource has a completely different remediation impact.
2. Parallel scans need rate control
Parallel scans are mandatory to scale.
Parallel does not mean firing API calls without limit.
The necessary controls:
- Concurrency limit per Landing Zone
- Concurrency limit per account
- Retry with exponential backoff
- Timeouts per job
- Partial-result handling
- Explicit scan status
- Error classification
A good CSPM engine does not only know that a scan succeeded. It knows where it failed, whether the failure is a credential issue, throttling, a disabled region, or missing permission.
3. Severity is not risk
Scanner severity is a technical signal. Risk is the result of combining that signal with business context.
For the dashboard to be useful, findings need enrichment with information such as:
- Is the resource public-facing?
- Does it hold sensitive data?
- Production or non-production?
- Is there internet exposure?
- Is there a compensating control?
- Which team owns it?
- How long has the finding been open?
- Is there a realistic exploit path?
Without a risk-scoring layer, the dashboard drowns in critical/high findings without giving the team a clear order of operations.
What this produced
After rolling out this design, the result was a centralised CSPM dashboard with the baseline capabilities:
- Posture view per Landing Zone.
- Drill down by account, region, and service.
- Filters by severity, risk score, framework, and owner.
- Scan status tracking.
- Raw evidence preserved for audit.
- Remediation ordered by business risk rather than purely by technical severity.
More importantly, the security team no longer has to open individual AWS Consoles or scroll through separate reports to answer:
Where is the AWS estate most at risk right now?
What is still open
The engine currently refreshes the account inventory on a periodic schedule (every 15 minutes).
That is acceptable for audit and posture review, but insufficient for near-real-time detection when a new Landing Zone, account, or region is added.
The next direction is a more event-driven model:
- Detect new accounts from AWS Organizations events.
- Trigger scans when a new account or region appears.
- An idempotent ingestion pipeline.
- Separate scan orchestration from finding ingestion.
- Multi-cloud support on the same schema: AWS, Azure, GCP.
Summary
When building CSPM for an enterprise environment, the problem is not primarily about picking a scanner.
Prowler, ScoutSuite, Steampipe, and other open-source scanners can all produce findings. The harder layer is operational:
- How is the scan scope defined?
- How is parallelism controlled?
- How are findings normalised?
- Where does metadata and artifact data live?
- What is the dedup logic?
- How are owners assigned?
- What drives remediation priority?
- Does the dashboard help the security team decide?
The approach that worked:
- Treat the Landing Zone as the primary operational unit.
- Use Prowler as the initial scanner.
- Keep metadata in D1.
- Keep raw artifacts in R2.
- Normalise findings into a shared schema.
- Layer business-aware risk scoring on top of severity.
This is not a complete CSPM in the sense of a commercial product. It is a solid foundation for an internal CSPM platform that can grow by account, region, Landing Zone, and eventually multi-cloud.