
TL;DR
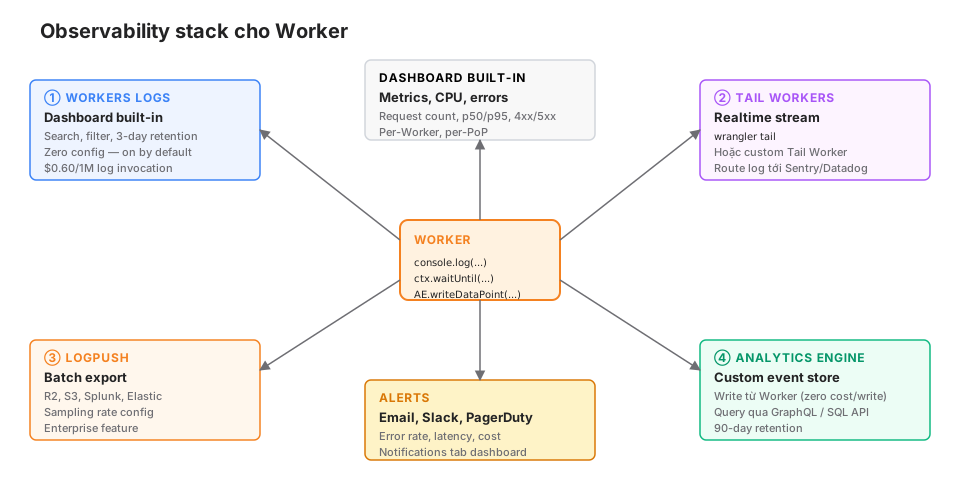
A Worker has no SSH, no /var/log. Observability lives in 4 layers:
- Workers Logs — built-in dashboard, 3-day retention, zero config, $0.60/1M invocations. Enough for 90% of daily debugging.
- Tail Workers — real-time stream via
wrangler tailor a custom Tail Worker that forwards to Sentry/Datadog. - Logpush — batch export request logs to R2, S3, Splunk, Elastic. Enterprise, typically for compliance.
- Analytics Engine — a custom event store. Write from the Worker, query via SQL API. 90-day retention. For app-specific custom metrics.
Main thesis:
Worker logs aren’t Linux logs. No files, no SSH. Debugging production means structured logs + request IDs + Tail Worker streaming + Analytics Engine metrics. Set it up right from day one = 80% of incidents resolved in 5 minutes instead of 5 hours.
This post covers: the 4 layers with real code, structured logging patterns, Analytics Engine schema + SQL queries, email/Slack/PagerDuty alerts, Sentry integration, and a real incident debug playbook.
This post opens Block 5 (Production). Part 18 goes into Security.
Who this is for
- Developers who just deployed a Worker to production and want to know how it’s doing.
- Teams debugging incidents: 5xx spikes, rising latency, missing data.
- Anyone who needs custom metrics (feature usage, conversion funnels) but doesn’t want to set up Prometheus + Grafana.
Recommended prerequisites: Part 2 (runtime), Part 12 (CI/CD).
By the end of this post you will:
- Implement structured logging with request IDs.
- Set up a Tail Worker forwarding to Sentry in under 30 minutes.
- Write custom metrics via Analytics Engine + query via SQL.
- Alert when error rate > 1% or p95 latency > 500ms.
What this post isn’t about
- Full-featured APM (Datadog, New Relic): integrations exist but aren’t native Cloudflare. Focus is on the native stack + Tail Worker bridges.
- Compliance log retention: if you need it seriously, use Logpush → R2 and policy rules there. This post doesn’t cover GDPR/HIPAA details.
- Complex distributed tracing (Jaeger, Zipkin): Workers are single-hop stateless, so full tracing isn’t first-class. Request ID patterns cover most edge-function needs.
The 4 layers at a glance
When to use which
| Use case | Layer |
|---|---|
| Debug “why did this request 500?” | Workers Logs |
| Stream logs in real time during an incident | Tail Worker / wrangler tail |
| Forward every error to Sentry | Custom Tail Worker |
| Compliance — keep every request log for 1 year | Logpush → R2 |
| Custom metrics (feature usage, conversion) | Analytics Engine |
| Alert when error rate > 1% | Cloudflare Notifications + Analytics Engine |
You don’t need all 4. Most teams start with 2 (Workers Logs + Analytics Engine) and add Logpush when compliance requires it.
Layer 1: Workers Logs
console.log/warn/error inside a Worker is auto-captured and viewable in the dashboard.
Dashboard access
Dashboard → Workers & Pages → Select Worker → Logs tabFilter by:
- Time range (last 15min, 1h, 6h, 24h, 3day).
- Status code (2xx, 4xx, 5xx).
- Log level (info, warn, error).
- Substring search in the message.
Enable in wrangler.jsonc
Observability is off by default on Free, on from Paid. Enable:
{
  "observability": {
    "enabled": true,
    "head_sampling_rate": 1.0  // 100% of requests are logged
  }
}
head_sampling_rate: 0.1 = 10% of requests logged (reduces cost for high-traffic sites).
Structured logging
console.log("user 123 logged in") is hard to query. Use JSON:
function log(level: string, message: string, context: Record<string, unknown> = {}) {
  console.log(JSON.stringify({
    level,
    message,
    timestamp: new Date().toISOString(),
    ...context,
  }));
}

// Usage
log("info", "user logged in", { userId: "abc-123", method: "oidc" });
log("error", "payment failed", { userId: "abc-123", orderId: "ord-1", reason: "card_declined" });
The dashboard can filter JSON fields (with Workers Logs v2). Searching for “userId:abc-123” finds every log for that user.
Request ID pattern
Every request gets an ID, which is included in every log and the response header.
export default {
  async fetch(request: Request, env: Env, ctx: ExecutionContext): Promise<Response> {
    const requestId = crypto.randomUUID();

    // Wrap log to auto-include requestId
    const log = (level: string, msg: string, ctx: Record<string, unknown> = {}) =>
      console.log(JSON.stringify({ level, requestId, msg, ...ctx, ts: Date.now() }));

    log("info", "request start", { path: new URL(request.url).pathname });

    try {
      const response = await handleRequest(request, env, log);
      response.headers.set("x-request-id", requestId);
      log("info", "request done", { status: response.status });
      return response;
    } catch (err) {
      log("error", "request failed", { error: err.message, stack: err.stack });
      return new Response("Internal error", {
        status: 500,
        headers: { "x-request-id": requestId },
      });
    }
  },
};
Users see x-request-id: abc-123 in the response header. Support tickets include the ID → faster debug.
Pricing
Workers Logs: $0.60/1M log invocations beyond the free tier. A high-traffic site at 1B req/month × 10% sampling = 100M logs × $0.60/1M = $60/month. Sampling rate matters.
Layer 2: Tail Workers
Real-time log stream while debugging live.
wrangler tail
npx wrangler tail my-workerStreams every log in real time. Filters:
npx wrangler tail my-worker --status=error
npx wrangler tail my-worker --search="user-123"
npx wrangler tail my-worker --sampling-rate=0.1
Use it during active incidents. No persistence — Ctrl+C and everything is gone.
Custom Tail Worker
A Tail Worker is a special Worker that receives events from a production Worker. You forward logs wherever you want.
my-logger/src/index.ts:
export default {
  async tail(events: TraceItem[], env: Env): Promise<void> {
    for (const event of events) {
      // event.scriptName, event.outcome, event.logs, event.exceptions
      if (event.outcome === "exception" || event.exceptions.length > 0) {
        await sendToSentry(event, env);
      }

      // Forward all error-level logs to Datadog
      for (const log of event.logs) {
        if (log.level === "error") {
          await sendToDatadog(log, env);
        }
      }
    }
  },
} satisfies ExportedHandler<Env>;

async function sendToSentry(event: TraceItem, env: Env) {
  await fetch(env.SENTRY_DSN, {
    method: "POST",
    headers: { "Content-Type": "application/json" },
    body: JSON.stringify({
      message: event.exceptions[0]?.message,
      request: event.event,
      tags: { worker: event.scriptName },
    }),
  });
}my-logger/wrangler.jsonc:
{
  "name": "my-logger",
  "main": "src/index.ts",
  "compatibility_date": "2026-05-01"
}
Deploy:
cd my-logger && npx wrangler deployAttach to the production Worker (my-app/wrangler.jsonc):
{
  "name": "my-app",
  "tail_consumers": [
    { "service": "my-logger" }
  ]
}
Deploy my-app. Now every my-app request emits an event to my-logger, which forwards to Sentry.
Sentry integration
The toucan-js library is optimized for Workers:
import Toucan from "toucan-js";

export default {
  async fetch(request: Request, env: Env, ctx: ExecutionContext): Promise<Response> {
    const sentry = new Toucan({
      dsn: env.SENTRY_DSN,
      context: ctx,
      request,
      environment: env.ENVIRONMENT,
    });

    try {
      return await handleRequest(request, env);
    } catch (err) {
      sentry.captureException(err);
      return new Response("Internal error", { status: 500 });
    }
  },
};
Inline capture differs from a Tail Worker: inline blocks the request until Sentry acks. Tail Workers are async and don’t impact production latency.
Recommendation: Tail Worker for production, toucan-js only when you need per-request stack traces.
Layer 3: Logpush
Batch export request logs to R2, S3, Splunk, Elastic, Datadog.
Setup (Enterprise feature)
Dashboard → Analytics & Logs → Logpush → Create job.
Config:
- Dataset: HTTP requests, Workers traces, Spectrum, DNS firewall, etc.
- Destination: R2 bucket, S3 bucket, HTTP endpoint.
- Fields: ClientIP, Datetime, EdgeResponseStatus, etc.
- Sampling: 0.01 = 1% of requests.
- Format: JSON, NDJSON, CSV.
R2 destination:
{
  "destination_conf": "r2://my-bucket?account-id=xxx&access-key-id=xxx&secret-access-key=xxx",
  "dataset": "workers_trace_events",
  "fields": "Event,EventTimestampMs,Outcome,ScriptName,Logs,Exceptions",
  "kind": "instant-logs"
}
Use cases
- Compliance: keep logs for 1 year (PCI, HIPAA, SOC2).
- Security analysis: WAF logs → SIEM (Splunk/Elastic).
- Long-term trends: metrics beyond 90 days (Analytics Engine limit).
- Cross-system correlation: Worker logs + AWS logs in a single Datadog.
Cost
Logpush is an Enterprise feature. Contact sales. Consider alternatives:
- Workers Logs (3-day) + Analytics Engine (90-day) for 99% of cases.
- Custom Tail Worker → R2 for budget-conscious teams.
Poor-person’s Logpush
// Tail Worker writes events to R2
export default {
  async tail(events: TraceItem[], env: Env): Promise<void> {
    const ndjson = events.map((e) => JSON.stringify(e)).join("\n");
    const key = `logs/${new Date().toISOString().slice(0, 13)}/${crypto.randomUUID()}.ndjson`;
    await env.R2.put(key, ndjson);
  },
};
One prefix per hour, one file per batch. A daily Scheduled Worker merges small files into bigger ones.
Cost: R2 storage $0.015/GB. 100M events × ~500 bytes each = 50GB = $0.75/month. Much cheaper than Logpush.
Layer 4: Analytics Engine
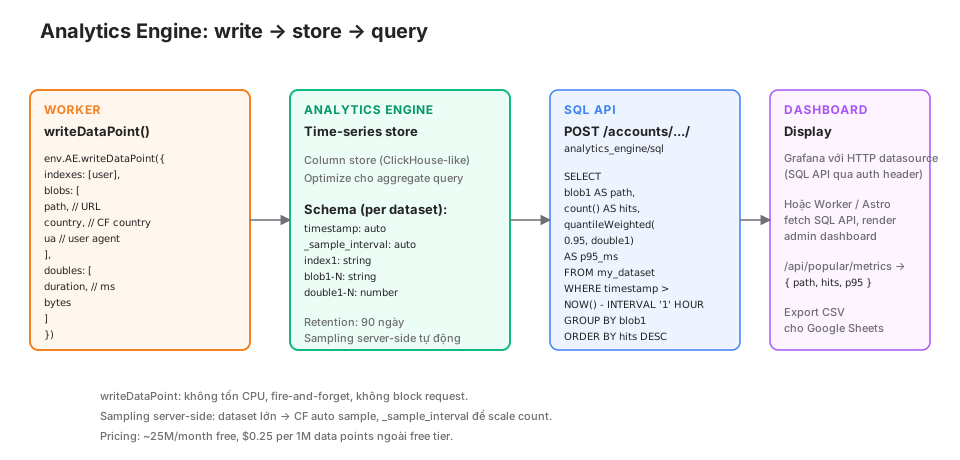
A custom event store. The Worker writes datapoints, and you query via SQL API.
Setup
wrangler.jsonc:
{
  "analytics_engine_datasets": [
    { "binding": "AE", "dataset": "my_app_events" }
  ]
}
Write
env.AE.writeDataPoint({
  indexes: ["user:abc-123"],
  blobs: [
    "/api/search",       // blob1: path
    "vn",                // blob2: country
    "claude-3.5",        // blob3: model used
  ],
  doubles: [
    250.5,               // double1: duration ms
    1024,                // double2: response size bytes
  ],
});
Schema:
- indexes: up to 1, string, high-cardinality filter field.
- blobs: up to 20, strings, low-cardinality filter + groupBy fields.
- doubles: up to 20, numbers, aggregate fields.
Writing doesn’t charge Worker CPU. Fire-and-forget.
Query via SQL API
POST to https://api.cloudflare.com/client/v4/accounts/<account-id>/analytics_engine/sql:
SELECT
  blob1 AS path,
  count() AS hits,
  quantileWeighted(0.5, double1) AS p50,
  quantileWeighted(0.95, double1) AS p95,
  quantileWeighted(0.99, double1) AS p99
FROM my_app_events
WHERE timestamp > NOW() - INTERVAL '1' HOUR
GROUP BY path
ORDER BY hits DESC
LIMIT 20
Auth: Authorization: Bearer <scoped-api-token>.
Practical example: popular posts
// Worker: log each pageview
async function fetch(request: Request, env: Env) {
  const response = await handleRequest(request, env);

  if (response.ok && request.url.includes("/blog/")) {
    env.AE.writeDataPoint({
      indexes: [request.cf?.country ?? "unknown"],
      blobs: [
        new URL(request.url).pathname,
        request.headers.get("user-agent") ?? "",
        request.headers.get("referer") ?? "",
      ],
      doubles: [1],  // placeholder, use count() instead
    });
  }

  return response;
}
Query top posts for the past week:
async function getPopularPosts(env: Env): Promise<PopularPost[]> {
  const sql = `
    SELECT blob1 AS path, count() AS views
    FROM my_app_events
    WHERE timestamp > NOW() - INTERVAL '7' DAY
      AND blob1 LIKE '/blog/%'
    GROUP BY blob1
    ORDER BY views DESC
    LIMIT 10
  `;

  const response = await fetch(
    `https://api.cloudflare.com/client/v4/accounts/${env.CF_ACCOUNT_ID}/analytics_engine/sql`,
    {
      method: "POST",
      headers: {
        Authorization: `Bearer ${env.AE_API_TOKEN}`,
        "Content-Type": "application/json",
      },
      body: sql,
    }
  );

  const { data } = await response.json();
  return data;
}
This blog’s /api/popular endpoint uses exactly this pattern.
Pricing
- ~25M data points/month free tier.
- $0.25 per 1M data points after that.
- SQL queries: free (at reasonable usage).
Example: 1M page views × 2 writes per view (page + api) = 2M data points/month = free.
Server-side sampling
Large datasets (>1B) → Cloudflare auto-samples. The _sample_interval field on each row tells you how many real events that row represents.
SELECT sum(_sample_interval) AS real_count
FROM my_dataset
count() returns the row count (sampled). sum(_sample_interval) returns the estimated real event count.
Alert setup
Cloudflare Notifications
Dashboard → Notifications → Add. Notification types:
- Worker Errors: error rate above a threshold.
- Worker CPU: CPU time exceeded.
- HTTP 5xx rate: zone-level.
- Billing: cost > $X.
Destinations: Email, Webhook, PagerDuty, Slack.
Simple thresholds. No complex aggregation. Enough for 80% of needs.
Alerts with Analytics Engine + Scheduled Worker
More complex: a scheduled Worker queries AE every 5 minutes and posts to Slack when a threshold is breached.
// scheduled handler
export default {
  async scheduled(event: ScheduledEvent, env: Env, ctx: ExecutionContext) {
    const result = await querySQL(env, `
      SELECT
        countIf(double1 >= 500) AS errors,
        count() AS total
      FROM my_app_events
      WHERE timestamp > NOW() - INTERVAL '5' MINUTE
    `);

    const { errors, total } = result.data[0];
    const errorRate = errors / total;

    if (errorRate > 0.01) {  // > 1%
      await fetch(env.SLACK_WEBHOOK, {
        method: "POST",
        body: JSON.stringify({
          text: `🚨 Error rate ${(errorRate * 100).toFixed(2)}% (${errors}/${total})`,
        }),
      });
    }
  },
};wrangler.jsonc:
{
  "triggers": {
    "crons": ["*/5 * * * *"]
  }
}
Runs every 5 minutes. More detailed than built-in alerts.
Debug playbook: a real incident
Real scenario: a user reports “5xx when subscribing to the newsletter”. 10:30 AM, mid-meeting.
Minute 1: Workers Logs
Dashboard → Worker my-app → Logs. Filter status: 5xx, last 30 min.
See 15 error logs, all between 10:20-10:28. Every log has:
{
  "level": "error",
  "msg": "request failed",
  "requestId": "...",
  "error": "D1_ERROR: too many requests"
}
Root cause: D1 rate limit.
Minute 2: check D1 metrics
Dashboard → D1 → Metrics. Query count: spike from 50/s to 300/s at 10:15-10:28. Someone’s hitting /api/subscribe hard.
Minute 3: Tail Worker checks abuse
wrangler tail my-app --search="/api/subscribe"200 requests/minute from the same IP. Bot attack.
Minute 4: mitigate
Deploy a rate-limit rule:
// Add to Worker
const subscribeLimiter = env.RATE_LIMITER.get(env.RATE_LIMITER.idFromName(`ip:${clientIP}`));
const { allowed } = await subscribeLimiter.fetch(...).json();
if (!allowed) return new Response("Too many", { status: 429 });
Push → CI → deploy.
Minute 5: verify
wrangler tail shows 429s returning to the bot. D1 query count drops back to baseline.
Post-incident
Analytics Engine query:
SELECT blob1 AS ip, count() AS req
FROM subscribe_events
WHERE timestamp > NOW() - INTERVAL '1' HOUR
GROUP BY ip
ORDER BY req DESC
LIMIT 20
Confirms the attack scope, files abuse report. Permanent rule via WAF.
Total time: 5 minutes from report → mitigation. Thanks to having all 4 observability layers ready.
Gotchas
① console.log doesn’t format in the browser console
console.log(obj) in the Worker dashboard shows [object Object]. Use console.log(JSON.stringify(obj)). Workers Logs v2 auto-parses JSON.
② waitUntil for async logs
A log call to an external service (Sentry, Datadog) without await → the request returns before the log is sent. Use ctx.waitUntil():
ctx.waitUntil(sendToSentry(error));
return response;
③ Analytics Engine _sample_interval is easy to forget
Datasets > 1B datapoints get sampled. Queries using count() underreport. Always use sum(_sample_interval) for totals:
-- Wrong: count() only counts rows
SELECT blob1, count() FROM ae GROUP BY blob1

-- Right: scale by _sample_interval
SELECT blob1, sum(_sample_interval) FROM ae GROUP BY blob1
④ Request logs blow up cost
1B requests/month × Workers Logs $0.60/1M = $600/month for logs alone. Sampling at 10% cuts that to $60. Set head_sampling_rate from day one.
⑤ Tail Worker infinite loops
Tail Worker log = one log per production Worker request = one log. If Tail Worker logs itself = infinite log loop. Don’t log inside the Tail Worker unless necessary.
⑥ Sensitive data in logs
console.log(request.headers) dumps the Authorization token. Dangerous PII. Redact:
function redact(headers: Headers): Record<string, string> {
  const obj = Object.fromEntries(headers);
  delete obj.authorization;
  delete obj.cookie;
  if (obj["x-api-key"]) obj["x-api-key"] = "***";
  return obj;
}
⑦ Log buffer limits
Workers cap at 128 log entries/request in the dashboard. High-throughput verbose-log services = rotate through Tail Worker → R2.
⑧ Timezones
Cloudflare log timestamps are UTC. The dashboard can convert to local, the API returns UTC. Document it clearly for your team.
Setup from scratch: 30 minutes
Minutes 0-5: enable observability in wrangler.jsonc, deploy. Logs appear in the dashboard immediately.
Minutes 5-15: structured logging helper + request IDs. Every log = JSON with requestId.
Minutes 15-25: Analytics Engine dataset + writeDataPoint per request. Key metrics: path, duration, status.
Minutes 25-30: Cloudflare Notifications alerts for error rate + Slack webhook.
30 minutes = full observability stack for a small/medium app.
Production checklist
-
observability.enabled: trueinwrangler.jsonc. - Sampling rate tuned to traffic (1.0 for low, 0.1 for high).
- Structured JSON logging with level, requestId, timestamp.
- Request ID in the response header for support use.
- Redact sensitive fields (tokens, PII) before logging.
- Tail Worker forwards errors to Sentry or external monitoring.
- Analytics Engine dataset for business metrics (page views, conversion, latency).
- Reusable SQL queries for dashboards /
/api/metrics. - Alerts for error rate, p95 latency, cost budget.
- Scheduled Worker for complex alerts (when built-in Notifications aren’t enough).
-
ctx.waitUntil()for async log calls. - Logpush to R2 if compliance / long-term retention is required.
Wrap-up
Observability isn’t optional. Production Workers have no SSH — if you don’t log, you know nothing. Cloudflare’s 4 layers cover: daily debug (Workers Logs), incident streaming (Tail Workers), compliance (Logpush), custom metrics (Analytics Engine).
Set it up right in 30 minutes = save dozens of hours of debugging. Skip it = fly blind in production.
Part 18: Security — secret management, CSP headers, Bot Management, Turnstile, Cloudflare Access, signed cookie patterns, and defense-in-depth for Workers.