TL;DR
DEX (Digital Experience Monitoring) measures the user experience on Cloudflare One, answering the question “Gateway up, Access up — so why does Alice say Salesforce is slow?”. The control-plane dashboard doesn’t see the gap; DEX does.
Three pillars:
- Synthetic tests — WARP-client-scheduled HTTP / DNS / traceroute probes from inside the tunnel.
- Passive fleet signals — WARP connection state, version, resource impact.
- Latency-leg breakdown — DNS / TCP / TLS / TTFB / Download — diagnosing the bottleneck in the right layer.
This post is not a feature tour. It is the ops handbook for DEX:
- Why “prevention up” ≠ “experience up” (real examples).
- Deeper architecture: client buffering when the CF DEX API is down, retry, stale config, telemetry privacy.
- A pragmatic SLO framework: Access 99.5% hard, DEX 98% medium, Fleet 95% soft — opinion with reasoning.
- Five failure modes DEX does not see — tools have bounded scope.
- When DEX is overkill.
Part 15, opening the Observability & Ops block.
Who this is for
- Platform engineers operating a Zero Trust fleet of > 100 users, reacting to tickets instead of predicting them.
- SREs who need to define SLOs for the secure-access path in a Zero Trust org.
- Helpdesk managers looking for data to prove “tickets dropped 40%” after DEX.
Recommended prior reading:
- Part 9 WARP — the client is the DEX agent.
- Part 14 Logs — DEX results stream through the same pipeline.
What this post does not cover
- APM inside application code (New Relic, Datadog APM) — different scope; DEX measures the access path, not code internals.
- Browser Real User Monitoring (CF Browser Insights) — separate product.
- Cloudflare Radar (global Internet trends) — public data, different use case.
Prevention UP, Experience DOWN — in practice
A real scenario:
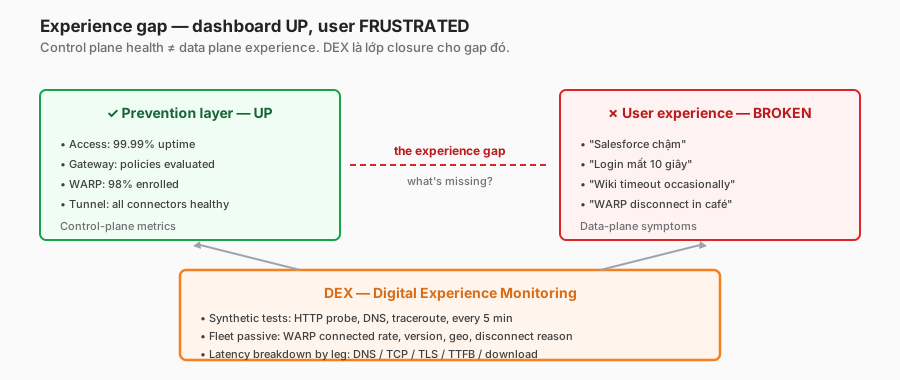
- Dashboard: Access 99.99% monthly uptime. Gateway 99.95%. WARP enrollment 98%. Everything green.
- Helpdesk tickets that week: 18 “Salesforce slow”, 5 “cannot connect WARP”, 3 “app timeout”.
- Leadership asks: “Is the security platform up?” → “Yes.” “Then why are users miserable?” → silence.
The gap: the dashboard measures the control plane (policy evaluator, API, tunnel state). Users experience the data plane (time to first byte, render time, call drop rate).
The actual cause of “Salesforce is slow”
Drilling into those 18 tickets with DEX data:
- 8 tickets (44%): WARP routed through a distant PoP. HCM users expected Singapore, but 8 cases landed in Tokyo. +60ms latency. A Cloudflare issue — reported to CF, they investigated (BGP peering reconfigured the following week).
- 4 tickets (22%): Salesforce itself was slow (vendor side). CF added 15ms, the origin added 800ms. Not a CF issue.
- 3 tickets (17%): user’s home ISP was slow (cellular, spotty). Not a CF issue.
- 2 tickets (11%): a newly deployed DLP policy added 40ms to Gateway HTTP inspection. A CF config issue — the rule was rolled back and revisited.
- 1 ticket (5.5%): TLS handshake was slow because the origin’s OCSP stapling was broken. An origin issue — Salesforce was informed.
Without DEX, all 18 tickets looked like “CF slow”. With DEX: 2/18 were actually CF action items. 16/18 were noise + vendor + user ISP.
Value: not “magic detection” but “efficient triage”
DEX doesn’t solve an ISP problem or fix an origin. It frees you from guessing. Saved time is the value.
Helpdesk MTTR dropped from 4h → 45 minutes in a 400-person org two months after DEX rolled in. Not magic — data.
Architecture — the depth a feature tour doesn’t show
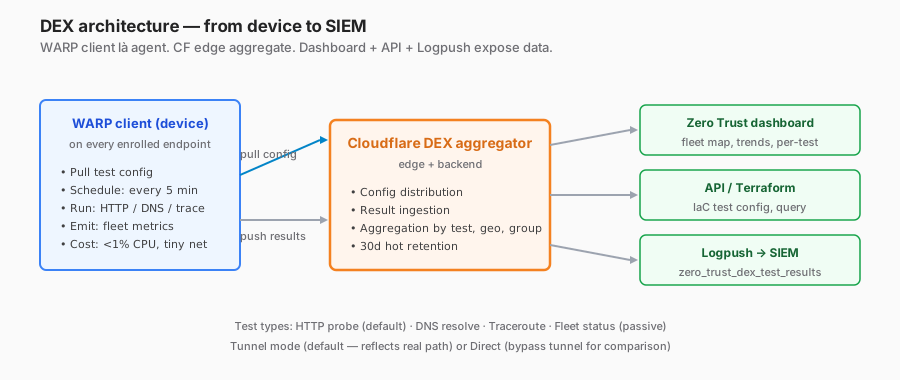
The high-level is well known: client test → CF store → dashboard. The failure modes are where depth matters.
Client config pull
- The client polls the CF API every 30 minutes for config updates.
- Local cache → fine when the CF API is down for 30–60 minutes.
- Gotcha: if admins change test configuration while the API is down, the rollout is delayed 30–60 minutes. Not atomic.
Test execution
- Scheduled every 5 minutes (default, tunable 1–15 minutes).
- Tests run inside the WARP tunnel by default (so the measured path = the user’s path).
- Resources: 0.5–1% CPU at peak, <100 KB per test.
Result push
- The client POSTs the result to the DEX API after each test.
- Retries: three attempts with exponential backoff (1s, 4s, 16s).
- If the API is down > 1 minute: the client buffers results locally, on disk, for up to 24h (5 MB max).
- Resume: when the API comes back, results are batch-uploaded with preserved timestamps → out-of-order delivery is handled server-side.
Telemetry privacy
Passive fleet data collected: connection state, version, geo (city-level), connection type (wifi/cellular). Not collected: the specific URLs a user browses, content, real screen time per app.
Synthetic test data: the URL being probed (this is config, not user activity), and latency metrics. Not collected: the user’s actual interactions in Salesforce.
A good talking point if a works council / union asks — the scope is narrower than APM.
Stale config scenario
An admin disables a test (removes the target). Clients that had already pulled the old config will still run the test — up to 30 minutes of drift. The dashboard shows stale results from that last window. This flag matters when investigating: “test X is still green after I removed it?” — yes, because of config TTL.
Scaling
Enterprise 10,000+ devices = many probes. CF rate-limits per account. Rule of thumb: don’t enable 20 tests × 10K devices × every 5 minutes = 2.4M test results/day. CF pushes back on the quota.
Strategy:
- 3–5 critical tests for every device.
- Region-specific tests (APAC only) reduce load.
- Lower frequency for less-critical tests (15 minutes instead of 5).
Latency leg breakdown — the fundamental tool
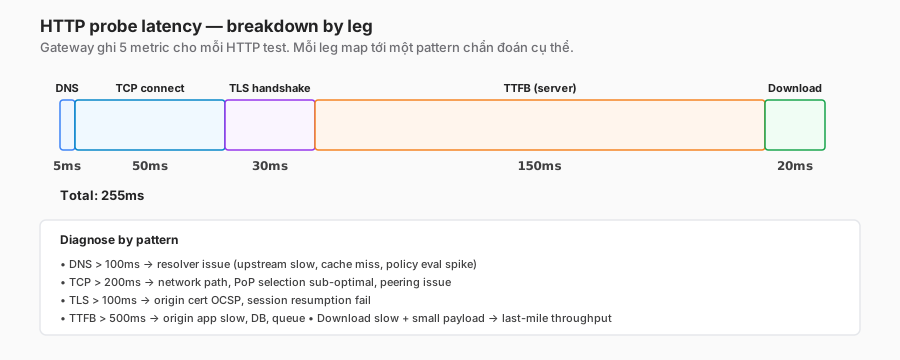
The single biggest value DEX provides. “Salesforce is slow” is meaningless without a breakdown:
- DNS slow → resolver issue (CF resolver health, a policy-eval spike).
- TCP connect slow → network path (BGP peering, congestion, PoP selection).
- TLS handshake slow → origin cert issue (OCSP stapling broken, session resumption broken).
- TTFB slow → origin app slow (database, queue, actual server processing time).
- Download slow → throughput issue (last-mile, concurrent flows, WARP overhead).
Diagnostic decision tree
User complaint: "Salesforce is slow"
↓
Query DEX: http_test.salesforce.com TTFB p95, last 30 min
↓
Baseline vs measured?
  Normal (< 800ms) → user-specific issue, not platform
  2× baseline → drill into the breakdown
    DNS > 100ms → CF DNS Gateway issue, ticket CF support
    TCP > 200ms → traceroute test
      Hops in the expected path → peering issue on CF side
      Extra hop / different ASN → BGP routing issue
    TLS > 100ms → check origin OCSP
    TTFB > 1s → origin issue, talk to Salesforce
    Download slow + small payload → last-mile issue
Real drill cost: 10–15 minutes once you’re familiar with the breakdown. Without DEX, tickets bounce between IT / Network / Vendor support teams for a day.
Tunnel vs direct pair test
A pair test is critical for top SaaS. Same target, one test through the WARP tunnel, one direct (bypass tunnel).
- name: "Salesforce via tunnel"
  target: "https://company.my.salesforce.com/"
  route: tunnel
  frequency_min: 5
- name: "Salesforce direct"
  target: "https://company.my.salesforce.com/"
  route: direct
  frequency_min: 5
Compare in the dashboard:
- Tunnel consistently slower by 5–15ms → normal CF overhead.
- Tunnel 50ms+ slower → sub-optimal CF PoP selection, investigate.
- Direct slower → user ISP issue, CF isn’t the problem.
Opinion: every critical SaaS deserves a pair test. The cost is minimal (two tests per SaaS), and the clarity is enormous.
Fleet insights — passive signals
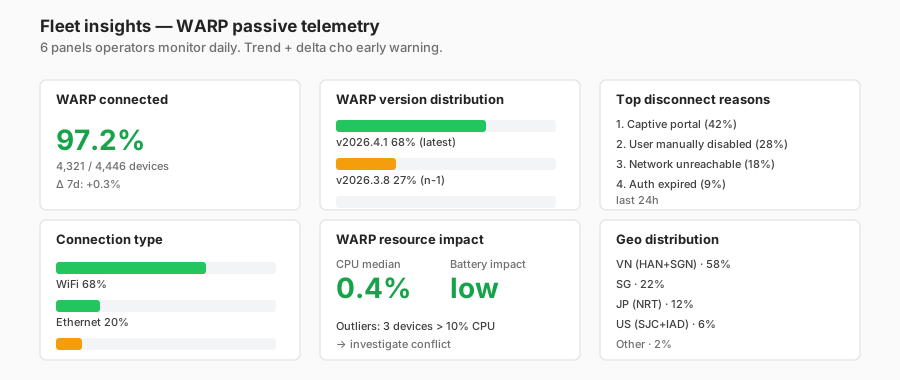
Fleet = passive telemetry emitted by the WARP client. Lighter than synthetic tests, no target config needed.
Core signals to watch daily
1. Connected rate
- Target: > 95% of devices connected during active hours.
- Alert: a drop of > 3 percentage points within 1 hour = incident.
- Common causes: MDM push broken, CF cert update, captive-portal surge.
2. Version distribution
- Target: > 80% on the latest, > 95% within n-2.
- Alert: devices stuck on > n-3 with a known CVE → MDM force-upgrade.
- Reality: an enterprise org typically has three version tails (slow-adoption policy vs. early adopters).
3. Disconnect-reason analysis
- Top-reason breakdown daily:
- Captive portal (airport, hotel) — expected, ~40%.
- User manually disabled (work-life boundary) — tolerate, educate.
- Network unreachable (VPN conflict, firewall rule) — investigate.
- Auth expired — token TTL misconfig or IdP issue.
- Alert: reason distribution shifts > 15% → something changed in the environment.
4. Resource impact
- WARP CPU median < 1% across the fleet.
- Outliers > 10% CPU: typically conflicts with VPN clients, EDR software, or corporate proxies. Investigate case by case.
Fleet as a leading indicator
Fleet connected drops precede tickets by 30–60 minutes. If a drop starts at 9:15am, tickets arrive around 10am. Proactive: page at 9:15, investigate → catch the issue before 80% of users are affected.
SLO framework — pragmatic, not the SRE textbook
Every DEX post mentions SLOs. Most regurgitate the Google SRE book (p95 < 2s, 99.9% target, error budget). The real question: which SLO for which component, and why.
Zero-Trust-specific tiers
| Service | SLI | SLO | Rationale |
|---|---|---|---|
| Access login | Success rate | 99.9% | Hard constraint — login failure = no productivity, immediately noticeable. Alert fatigue stays low because failures are infrequent. |
| Access login | p95 latency | < 2s | Perception threshold. Over 2s the user thinks “broken”. |
| Gateway DNS | p95 resolve | < 50ms | Soft — slow DNS is annoying, not blocking. Multiple fallback mechanisms. |
| Gateway HTTP proxy | p95 added latency | < 30ms | Medium — affects every request. |
| WARP fleet | Connected rate | > 95% | Soft — some disconnects are expected (mobile, captive portals). |
| Critical SaaS (Salesforce, M365) | p95 TTFB | < 800ms | Medium. The threshold where users notice. |
| DEX itself | Test completion rate | > 95% | Internal — if DEX breaks, you’re blind. |
Why not 99.99% across the board
Because alert fatigue kills monitoring. A 99.99% target → 4.3 minutes/month of allowed downtime. Every 5-minute blip pages someone. The SOC starts muting. Real 99.99% requires serious engineering (multi-region DR, read replicas, chaos-tested) — justifiable for Access login, not for the DNS resolver.
Error-budget practice
Monthly budget per SLO. Burn rate > 50% of the month’s budget in < 7 days → freeze non-critical deploys. Actually enforced, not theoretical.
I’ve seen teams ignore the error budget — “we were still 99.5% last month” → deploy a risky change → breach 99% → tickets + leadership question. The framework only works if it’s enforced.
Start conservative, tighten
New Zero Trust rollout: start with loose SLOs (99% Access login, < 100ms DNS, 90% fleet). Measure the real baseline for three months. Tighten based on data, not aspiration.
Deploy risk: an enterprise sets 99.99% on day one → breach in week 2 → “the tool is broken” → rollback. Let the data set the target.
Five failure modes DEX DOES NOT see
Tools are bounded. An honest list:
1. Issues outside the WARP tunnel
DEX tests run inside the WARP tunnel. If a user isn’t on WARP (BYOD guest, contractor without enrollment, DNS-location mode) → DEX is blind.
Workaround: mandate WARP enrollment for every critical user. Accept that DNS-location users have lower observability.
2. Slow client-side rendering
DEX measures HTTP response time, not browser rendering. A Salesforce page with heavy JavaScript slow to interactive (5s render) but 200ms TTFB → DEX goes green.
Tool gap: Browser Real User Monitoring is needed. CF Browser Insights is a separate product.
3. Intra-page issues
A user clicks a button in Salesforce and the API behind it is slow. DEX doesn’t see individual user-session API calls. It only sees the initial page load.
Tool gap: vendor-side APM (Salesforce Trust portal, M365 Service Health) or a client-side beacon.
4. Specific network-path corner cases
A user on corporate wifi, a NAT misconfig causing WARP MTU mismatch, fragment drops. A DEX test from the same location might not reproduce, because tests run on randomised timing.
Tool gap: per-user diagnostics are harder to synthesise.
5. “The test target is a lie” scenario
DEX test https://salesforce.com/ → always 200 OK. The actual user flow: login → dashboard → specific report. Those deep paths aren’t being tested, and performance can differ.
Workaround: test targets that mimic real user journeys. Cost: more test config to maintain.
Alert patterns that actually work
Alerts that work
# Sustained latency spike — not a transient blip
- name: "Salesforce TTFB degraded"
  query: "avg_over_time(http_ttfb_ms{test='Salesforce'}[15m]) > 1200"
  min_duration: 30m      # avoid transient
  notify: slack-sre

# Fleet disconnect anomaly
- name: "Fleet WARP drop"
  query: "warp_connected_rate < 0.92 AND warp_connected_rate_15m_delta < -0.05"
  notify: pagerduty

# Regional pattern
- name: "APAC latency"
  query: "p95_over_time(http_ttfb{warp_location=~'SIN|HKG|NRT'}[30m]) > 1500"
  notify: slack-sre  # warning, not page
Alerts NOT to create
- Any single test failure — transient false alarm.
- Low-tier tests (marketing site) — not worth the noise.
- Fleet drops < 3% — within the noise band.
Maintenance windows
CF maintenance (patches, PoP rebalancing) → temporary degradation. Without a maintenance window in the alerting system → false pages. The CF status page API can feed into alert suppression.
Integration with Logpush + SIEM
Fully covered in Part 14. The DEX dataset is zero_trust_dex_test_results.
Key fields: timestamp, test_name, status_code, total_time_ms, DNS/TCP/TLS/TTFB/Download breakdown, user_email, device_id, warp_location.
SIEM correlations:
- User reports “Salesforce slow” + timestamp → query DEX for that user in that window, show the exact slow leg.
- Regional incident: group by warp_location, show degradation per PoP.
- Trend vs baseline: compare a 7d rolling average to the current 15m window.
When DEX is overkill
Not every org needs DEX:
- Fleet < 50 users. Direct communication + manual checks are enough. DEX ops overhead exceeds the value.
- No WARP mandate. DEX is tied to WARP. Partial fleet coverage = partial observability value.
- Traditional VPN stack unchanged — not yet migrated to Zero Trust. DEX is a post-migration tool.
- Budget constraints + early-stage rollout. Prioritise core controls (Access, Gateway) over observability. Add DEX in year 2.
- Org heavily reliant on native SaaS dashboards. Salesforce Trust portal and M365 Service Health cover 60% of the use cases. DEX adds a 40% increment — may not justify the cost.
Lessons worth keeping
- DEX doesn’t “solve” — it enables efficient triage. 18 tickets → 2 actionable. That’s the value.
- Pair tests (tunnel + direct) are critical for the top five SaaS. Separates CF-caused issues from vendor-caused ones.
- Pragmatic SLOs — start loose, tighten with data. Not 99.99% on day one.
- Passive fleet is a leading indicator — connected drops precede tickets by 30–60 minutes. Page on fleet alerts, not individual tests.
- Alert fatigue is real — three good alerts beat fifteen noisy ones. A mute culture kills the tool.
- Test targets should mimic user journeys, not generic homepages. More config to maintain — worth it.
- DEX is bounded — failure modes (client-side render, intra-page, BYOD non-WARP) need complementary tools.
- MDM force WARP version upgrades — otherwise the distribution tail grows, creating both a security risk and a DEX blind spot (old versions may lack telemetry).
Summary
DEX is proof of experience. The control-plane dashboard says “service up”; DEX answers “service works for whom, where, how fast.” A Zero Trust deployment without DEX is flying blind operationally.
Production recipe:
- Synthetic tests for critical paths (5–10 tests).
- Passive fleet watched daily (connected rate, version, disconnect reason).
- Pair tests for top SaaS — tunnel + direct comparison.
- Pragmatic SLOs by tier (Access hard, Gateway medium, Fleet soft).
- Alert discipline — 3–5 good alerts, no noisy ones.
- Accept bounded scope — complement with RUM / APM / vendor dashboards.
One line to remember:
DEX doesn’t answer “is there an issue” — it answers “which layer has the issue and who owns it”. Triage efficiency is the value, not magic detection.
Part 16 continues Observability & Ops with Device posture and continuous verification — moving from “verify once at login” to “verify every request”, EDR signals (CrowdStrike / SentinelOne / Defender), and the playbook when a device fails posture mid-session.
References
- Cloudflare DEX overview
- Fleet status
- Synthetic test setup
- DEX Logpush dataset
- Google SRE SLO framework
In this series:
- ← Part 14: End-to-end logs pipeline
- Next → Part 16: Device posture
- All parts: Cloudflare One Handbook series