TL;DR
Logs are the observability foundation of Cloudflare One. The native dashboard only keeps 30 days and makes cross-layer correlation hard. Production needs:
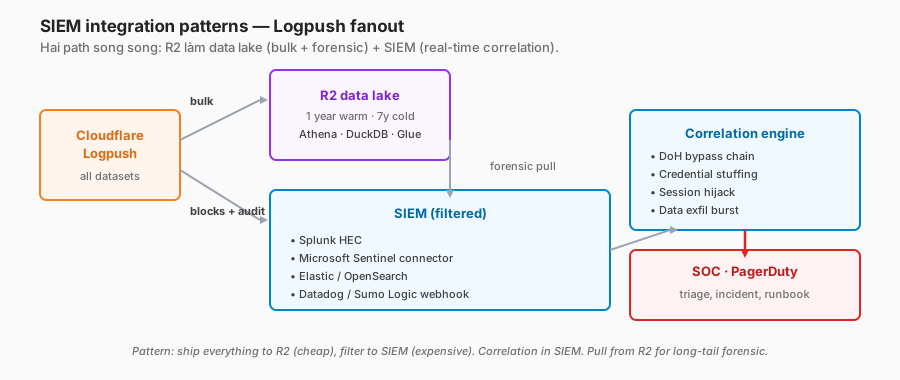
- Logpush — streaming export to destinations (R2, S3, Splunk, Sentinel, Datadog, …).
- Tiered retention — hot 30 days (CF), warm 1 year (R2/S3), cold 7 years (Glacier).
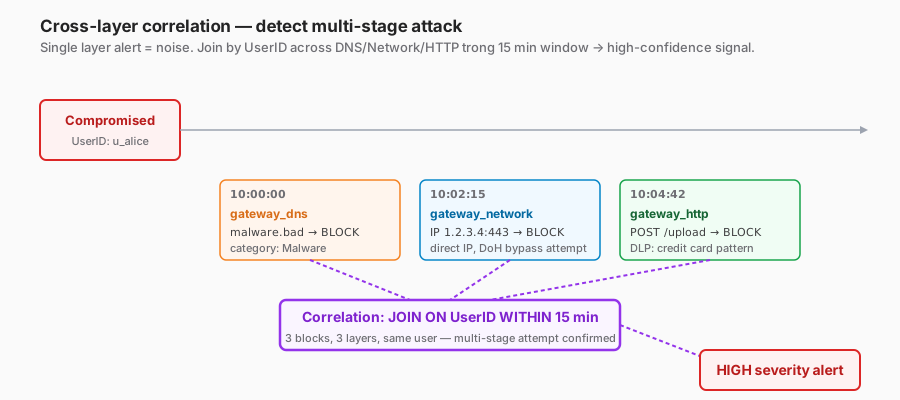
- Cross-layer correlation — join DNS + Network + HTTP + Access logs by
UserIDto catch multi-stage attacks. - Detection rules in the SIEM.
- Cost control — sampling, compression, lifecycle policy.
This post covers:
- The datasets Cloudflare One exposes.
- Logpush mechanics — batching, format, destinations.
- R2 as a data lake — setup + query with Athena/DuckDB.
- SIEM integration patterns — Splunk, Sentinel, Elastic.
- Correlation rules for DoH bypass, credential stuffing, session hijack.
- Cost and retention.
The thesis:
Logs aren’t an afterthought — they are the backbone of Zero Trust. Without a SIEM pipeline and cross-layer correlation, you have prevention but no detection. Attackers try every vector; you need to see all of them to detect a pattern.
This is Part 14 of the Cloudflare One Handbook and opens the Observability & Ops block (Parts 14–16).
Who this is for
- Security engineers building SIEM integration.
- SOC analysts writing cross-layer detection rules.
- Platform engineers setting up a data-lake observability layer.
Recommended prior reading:
- Any of Parts 11, 12, 13 — Logpush has been mentioned only at the surface.
- Part 9 — WARP (identity enrichment for logs).
After this post you will:
- Know every Cloudflare One dataset and the important fields in each.
- Be able to set up Logpush to R2 and a SIEM in the right format.
- Write cross-layer correlation rules that detect attack chains.
- Plan retention + cost without blowing the budget.
What this post does not cover
- General Cloudflare logs outside Zero Trust (CDN, WAF, Workers — a different post).
- Deep SIEM tuning (Splunk SPL, KQL optimisation) — brief mention only.
- Compliance-specific reporting (PCI, HIPAA) — retention is mentioned, detailed frameworks are not.
- Analytics Engine — separate post.
Concepts
- Dataset — a log stream Cloudflare exposes; each dataset has a fixed schema (
gateway_dns,gateway_network,gateway_http,access_requests, …). - Logpush — the Cloudflare service that pushes log batches to a destination over HTTP / S3.
- Destination — where logs land: R2, S3, GCS, Azure Blob, Splunk HEC, Sumo Logic HTTP, Datadog, New Relic.
- NDJSON — newline-delimited JSON, Logpush’s default format.
- Logpull — legacy pull API (deprecated for most datasets).
- SIEM — Security Information and Event Management: Splunk, Sentinel, Elastic, Sumo, Datadog.
- Data lake — bulk storage (R2/S3) + a query engine (Athena, DuckDB, BigQuery).
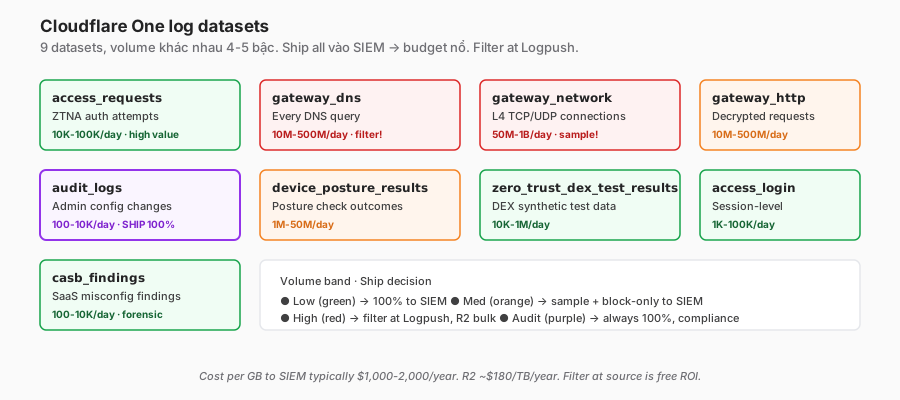
Cloudflare One datasets
| Dataset | Content | Volume (enterprise, typical) |
|---|---|---|
access_requests | Every ZTNA auth attempt — user, app, decision, identity | 10K–100K/day |
gateway_dns | Every DNS query through Gateway | 10M–500M/day |
gateway_network | L4 TCP/UDP connection events | 50M–1B/day |
gateway_http | HTTP requests (when decryption is on) | 10M–500M/day |
audit_logs | Admin / config changes | 100–10K/day |
device_posture_results | Device posture check results | 1M–50M/day |
zero_trust_dex_test_results | DEX (Digital Experience Monitoring) tests | 10K–1M/day |
access_login | ZTNA login events (sessions) | 1K–100K/day |
casb_findings | CASB scan findings on connected SaaS | 100–10K/day |
Dataset characteristics
- Access logs — lower volume, high value. Essential for forensics.
- Gateway DNS — broad coverage, moderate volume. Baseline monitoring.
- Gateway Network — highest volume. Expensive. Sample aggressively.
- Gateway HTTP — medium-to-high volume. Depends on the decrypt scope.
- Audit — must ship 100% (compliance).
Logpush mechanics
Batch behaviour
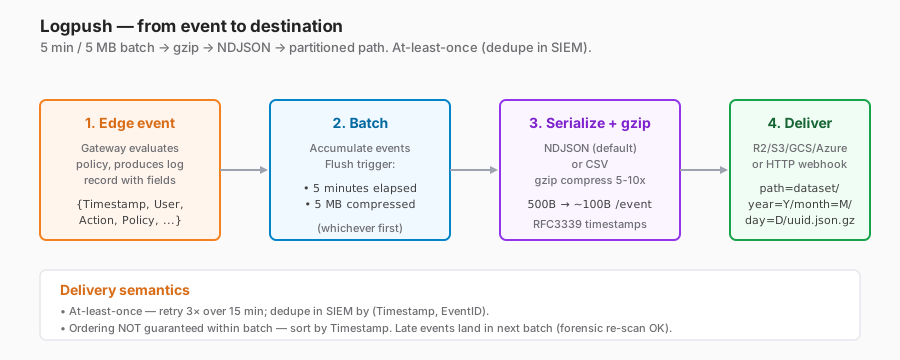
- Batch trigger: 5-minute tick OR 5 MB size (whichever first).
- Max batch: 5 MB compressed → ~50 MB uncompressed.
- Delivery: at-least-once (rare duplicates; the SIEM must dedupe by event ID).
- Ordering: NOT guaranteed inside a batch; use the timestamp field.
Format options
{
  "output_options": {
    "output_type": "ndjson",           // or "csv"
    "timestamp_format": "rfc3339",     // or "unix"
    "field_names": [],                 // empty = all
    "field_delimiter": ",",            // csv only
    "record_delimiter": "\n"
  }
}
Destination types
- Object storage: R2, S3, GCS, Azure Blob. Path template:
dataset/{DATE}/{TIME}. - HTTP webhook: generic — Splunk HEC, Datadog, Sumo, custom.
- Native SIEM: Sentinel connector (Microsoft ecosystem), official Splunk app.
Path templating
r2://gateway-logs/{dataset}/year={YEAR}/month={MONTH}/day={DAY}/hour={HOUR}/{UUID}.json.gzA Hive-partitioned layout → Athena/DuckDB queries are efficient. year/month/day partitioning is the standard.
Filter at source
{
  "filter": "{\"where\":{\"key\":\"Action\",\"operator\":\"eq\",\"value\":\"block\"}}"
}
Example: push only block events — reduces volume 80–90% for the DNS dataset.
R2 as a data lake
Why R2 over S3
- Egress free — querying R2 data costs no egress (S3 does).
- Native Cloudflare integration — direct Logpush, no IAM friction.
- Cheap storage ~$15/TB/month, comparable to S3, but free egress is the big win.
Setup
- Create an R2 bucket:
wrangler r2 bucket create gateway-logs- Create an API token for Logpush:
Dashboard → R2 → Manage R2 API Tokens → create a token with Object Read & Write.
- Configure Logpush:
curl -X POST \
  "https://api.cloudflare.com/client/v4/accounts/${ACCOUNT_ID}/logpush/jobs" \
  -H "Authorization: Bearer ${CF_API_TOKEN}" \
  -H "Content-Type: application/json" \
  --data @- <<'EOF'
{
  "name": "gateway-dns-to-r2",
  "dataset": "gateway_dns",
  "destination_conf": "r2://gateway-logs/dns/year={YEAR}/month={MONTH}/day={DAY}/?account-id=${ACCOUNT_ID}&access-key-id=${R2_KEY}&secret-access-key=${R2_SECRET}",
  "output_options": {
    "output_type": "ndjson",
    "timestamp_format": "rfc3339"
  },
  "enabled": true
}
EOF- Verify:
wrangler r2 object list gateway-logs --prefix dns/Batches appear within 5–10 minutes.
Query with DuckDB (local)
-- Install the httpfs extension
INSTALL httpfs;
LOAD httpfs;

-- Configure R2 credentials
SET s3_endpoint='<account-id>.r2.cloudflarestorage.com';
SET s3_access_key_id='<r2-key>';
SET s3_secret_access_key='<r2-secret>';
SET s3_url_style='path';

-- Query
SELECT
  Email,
  COUNT(*) as blocked_count,
  ARRAY_AGG(DISTINCT DNSQuestion) as domains
FROM read_json('s3://gateway-logs/dns/year=2026/month=05/day=15/*.json.gz')
WHERE Action = 'block'
GROUP BY Email
ORDER BY blocked_count DESC
LIMIT 20;
Runs locally — no cluster required.
Query with Athena (AWS)
R2 is S3-compatible; Athena queries it directly if the bucket is public or a cross-account role is configured. Pattern:
- A Glue Crawler scans R2 partitions → catalog table.
- Athena SQL runs over the catalog.
- Use CTAS (Create Table As Select) for an aggregate layer.
Cost: Athena at $5/TB scanned — partition pruning matters.
SIEM integration patterns
Splunk
Option A — HEC direct:
{
  "destination_conf": "splunk://hec.splunk.company.com/services/collector/raw?header_Authorization=Splunk%20<token>&channel=<uuid>&header_Content-Type=application%2Fjson&insecure-skip-verify=false",
  "dataset": "gateway_dns"
}
Option B — S3 → Splunk pull (cost-effective for high volume):
Logpush → R2 → Splunk SmartStore or a custom pull script.
SPL example — DoH bypass detection:
index=cloudflare sourcetype=gateway_network
| where match(SNI, "dns\\.google|dns\\.quad9\\.net|doh\\.opendns\\.com")
| where Action="block"
| stats count by UserID, Email, SNI
| where count > 5
| sort -count
Microsoft Sentinel
Native Cloudflare connector (in Content Hub):
- Install the “Cloudflare (using Azure Function)” connector.
- Provide a Cloudflare API token + account ID.
- Data flows to the Log Analytics workspace.
Alternative: Logpush → Sentinel via Event Hub.
KQL example — cross-layer correlation:
let timeframe = 1h;
Cloudflare_Gateway_DNS_CL
| where TimeGenerated > ago(timeframe)
| where Action_s == "block"
| where Categories_s contains "Malware"
| project UserID=UserID_s, blockedDomain=DNSQuestion_s, t_dns=TimeGenerated
| join kind=inner (
    Cloudflare_Gateway_Network_CL
    | where TimeGenerated > ago(timeframe)
    | where Action_s == "block"
    | project UserID=UserID_s, blockedIP=DestinationIP_s, t_net=TimeGenerated
) on UserID
| where t_net between (t_dns .. t_dns + 5m)
| project UserID, blockedDomain, blockedIP, t_dns, t_net
Detects: a user’s DNS lookup was blocked, and within 5 minutes they tried a direct IP — a multi-stage attempt.
Elastic / OpenSearch
Logstash pipeline:
input {
  s3 {
    bucket => "gateway-logs"
    endpoint => "<account-id>.r2.cloudflarestorage.com"
    access_key_id => "<r2-key>"
    secret_access_key => "<r2-secret>"
    codec => "json_lines"
  }
}

filter {
  if [dataset] == "gateway_dns" {
    mutate { add_field => { "[@metadata][index]" => "cf-gateway-dns-%{+YYYY.MM.dd}" } }
  }
}

output {
  elasticsearch {
    hosts => ["https://es.company.com:9200"]
    index => "%{[@metadata][index]}"
  }
}
Datadog
HTTP webhook destination:
datadog://http-intake.logs.datadoghq.com/api/v2/logs?header_DD-API-KEY=<key>&ddsource=cloudflare&service=gatewayDatadog parses JSON automatically and applies a pipeline for tagging.
Cross-layer correlation rules
Rule 1 — DoH bypass attempt
Signal: the same user is blocked at DNS and also blocked for a DoH destination at Network within the same 15 minutes.
Threat model: malware first tries the system resolver → blocked → falls back to DoH → also blocked. A confirmed compromise attempt.
let win = 15m;
let dns_blocks = Cloudflare_Gateway_DNS_CL
  | where Action_s == "block" and Categories_s has "Malware"
  | project UserID, t1=TimeGenerated, dns_q=DNSQuestion_s;
let doh_blocks = Cloudflare_Gateway_Network_CL
  | where Action_s == "block" and PolicyName_s has "DoH"
  | project UserID, t2=TimeGenerated, sni=SNI_s;
dns_blocks
| join kind=inner doh_blocks on UserID
| where t2 between (t1 .. t1 + win)
| project UserID, dns_q, sni, t1, t2Severity: high — open a ticket, isolate the device.
Rule 2 — Credential stuffing on Access
Signal: N failed Access logins against the same app in 10 minutes from different IPs.
Cloudflare_Access_CL
| where TimeGenerated > ago(10m)
| where Result_s == "blocked"
| summarize ip_count=dcount(IP_s), attempts=count() by App_s
| where attempts > 20 and ip_count > 5
Rule 3 — Session hijack indicator
Signal: the same UserID + SessionID appearing from different IPs and different countries within 5 minutes.
Cloudflare_Access_CL
| where TimeGenerated > ago(5m)
| summarize ip_list=make_set(IP_s), country_list=make_set(Country_s) by UserID, SessionID
| where array_length(ip_list) > 1 and array_length(country_list) > 1
Rule 4 — Data exfil burst
Signal: a user uploads > 1 GB through HTTP POST in 30 minutes to a destination that isn’t a corporate SaaS.
Cloudflare_Gateway_HTTP_CL
| where TimeGenerated > ago(30m)
| where Method_s == "POST" and ContentLength_d > 0
| where Host_s !in ("drive.google.com", "onedrive.live.com", "s3.company.com")
| summarize total_bytes=sum(ContentLength_d) by UserID, Email
| where total_bytes > 1073741824  // 1 GB
Rule 5 — Impossible travel
Signal: the same user logs in from two countries far enough apart that the implied travel speed exceeds 1,000 km/h.
Cloudflare_Access_CL
| where Result_s == "allowed"
| project UserID, Country_s, Latitude_d, Longitude_d, TimeGenerated
| sort by UserID, TimeGenerated asc
| extend prev_country=prev(Country_s), prev_time=prev(TimeGenerated),
         prev_lat=prev(Latitude_d), prev_lon=prev(Longitude_d)
| extend time_diff_h = (TimeGenerated - prev_time) / 1h
| extend dist_km = geo_distance_2points(prev_lon, prev_lat, Longitude_d, Latitude_d) / 1000
| where time_diff_h > 0 and time_diff_h < 12 and dist_km / time_diff_h > 1000
Retention strategy
Tiered storage
| Tier | Location | Retention | Cost (/TB/mo) | Use |
|---|---|---|---|---|
| Hot | Cloudflare dashboard | 30d | included | dashboard query, debug |
| Warm | R2 | 1y | ~$15 | forensics, SIEM source |
| Cold | R2 archive / Glacier | 7y | ~$1–4 | compliance, litigation |
R2 lifecycle policy
{
  "rules": [
    {
      "id": "archive-after-90d",
      "prefix": "gateway-logs/",
      "transitions": [
        { "days": 90, "storage_class": "INFREQUENT_ACCESS" }
      ]
    },
    {
      "id": "delete-after-7y",
      "prefix": "gateway-logs/",
      "expiration": { "days": 2555 }
    }
  ]
}
Compliance minimums
- PCI DSS 4.0: 1 year online, 1 year cold minimum for cardholder-related audit logs.
- HIPAA: 6 years.
- SOC 2: 1 year for audit, 3–7 years for security events.
- GDPR: minimum necessary, delete once the purpose is complete (usually < 1 year for detail, longer for aggregates).
Cost control
Volume reduction
1. Filter at Logpush — only ship events that matter:
"filter": "{\"where\":{\"key\":\"Action\",\"operator\":\"ne\",\"value\":\"allow\"}}"Skip allowed events → volume drops 80–90% for DNS/Network.
2. Sampling — random-sample allowed events for a baseline:
Cloudflare doesn’t natively support sampling at Logpush → work around it by shipping everything and sampling at the SIEM ingest pipeline.
3. Compression — Logpush gzip by default. When pushing to an HTTP webhook, verify the endpoint supports gzip.
4. Dataset selection — not every dataset belongs in the SIEM:
gateway_dnsblocked only → SIEM.gateway_dnsallowed → R2 raw (cold).gateway_networkblocked only → SIEM.audit_logs100% → SIEM (compliance).
Storage budget math
Enterprise, 1,000 users, 50M combined events/day:
- NDJSON ~500 bytes/event → ~100 bytes compressed.
- 5 GB/day uncompressed → 500 MB/day compressed.
- Year: ~180 GB compressed.
- R2: 180 GB × $0.015 = ~$2.70/month. Cheap.
SIEM ingest (Splunk): roughly $1,800/GB/year typical. Filter aggressively before shipping.
Compression ratio
NDJSON is repetitive (field names repeat) → gzip hits 5–10×. Parquet compresses better, but Logpush doesn’t output Parquet natively → convert at the R2 layer with a cron job.
Ongoing operations
Monitor Logpush health
# Check job status
curl "https://api.cloudflare.com/client/v4/accounts/${ACCOUNT_ID}/logpush/jobs" \
  -H "Authorization: Bearer ${CF_API_TOKEN}" | jq '.result[] | {name, enabled, last_complete, last_error}'
Alert when last_complete is older than 30 minutes = the job is stuck.
Alerting patterns
- Logpush job failed > 3 consecutive runs → page.
- Log volume drops > 50% below baseline → investigate (job stuck? CF outage? misconfigured filter?).
- SIEM ingestion lag > 15 minutes → SOC escalation.
- Storage approaching quota → alert before the cap.
Weekly pipeline validation
- Generate a synthetic event (a DNS query to a canary domain that policy blocks).
- Verify it lands in: CF dashboard (5 min) → R2 (10 min) → SIEM (15 min).
- Document in
/runbooks/logs-pipeline-health-check.md.
Troubleshooting
”Logpush job fails intermittently”
- Check the
last_errorfield. - Common causes: destination quota, auth token expired, network issue.
- CF auto-retries three times over 15 minutes; if all fail, the next batch retries.
”The SIEM isn’t getting new logs”
- Does the event exist in the dashboard? If not, upstream issue.
- Logpush job status: active,
last_completerecent? - Destination reachable? Test with curl.
- SIEM ingestion queue backlogged?
- Parser rule rejecting the event? Check the SIEM error log.
”Log volume suddenly 10× baseline”
- New decrypt policy enabled → HTTP volume surge.
- A new DNS location with heavy traffic.
- An attack scenario (scan, DDoS).
- Check the Logpush dashboard total-events/day trend.
”Athena query is expensive”
- Partition pruning not working → check that partitions exist in the Glue catalog.
- Full scan over a large prefix → add a
WHERE year/month/dayfilter. - Convert NDJSON → Parquet for frequently-queried ranges.
”Duplicate events in the SIEM”
- Logpush is at-least-once. CF retries can duplicate.
- Dedupe by
(Timestamp, EventID)in the SIEM. - Event-ID field varies per dataset — check the schema docs.
Checklist — production logs pipeline
Dataset coverage:
-
access_requests→ SIEM 100%. -
audit_logs→ SIEM 100%. -
gateway_dnsblocks → SIEM, all events → R2. -
gateway_networkblocks → SIEM, all events → R2. -
gateway_httpblocks + sensitive paths → SIEM, all → R2. -
device_posture_results→ SIEM daily summary. -
zero_trust_dex_test_results→ SIEM.
Infrastructure:
- R2 bucket created + lifecycle policy.
- Logpush jobs configured per dataset.
- Job-status monitoring + alerting.
- Retention matches compliance (PCI 1y+, SOC 3y+, HIPAA 6y).
SIEM:
- Native connector or HEC/webhook configured.
- Parser/dashboard for each dataset.
- Cross-layer correlation rules deployed.
- Alert routing to SOC/PagerDuty.
Detection:
- DoH bypass rule.
- Credential stuffing rule.
- Session hijack rule.
- Data exfil rule.
- Impossible travel rule.
- Policy-specific detection (tenant-aware rules).
Operations:
- Weekly synthetic-event verification.
- Monthly log-volume review.
- Quarterly detection-rule tuning.
- Runbook for “pipeline down”.
Lessons from practice
- Ship every dataset and enable every rule at once → ingestion cost explodes. Start lean: blocks-only + audit 100%, add allowed traffic when a detection use case emerges.
- NDJSON → Parquet conversion saves 60–70% storage + query cost. Worth a cron job after 30 days.
- Cross-layer correlation matters. Single-layer alerts are noisy; multi-layer joins cut false positives sharply.
- Attackers target the log system. A “log volume drop” detection rule is critical — disabling logging is often the first sign.
- R2 is the sweet spot for mid-volume. S3 is expensive on egress; BigQuery is overkill; Elastic ingest is expensive.
- Tune the SIEM quarterly. New apps, new SaaS, new threats → detection rules have to update. Stale rules = false sense of security.
- Compression + partitioning is not “nice to have” — at production scale, querying unpartitioned data costs hundreds of dollars per run.
- Test synthetic events weekly. A pipeline runs silent until it breaks. A canary event is the only way to know it’s alive.
Summary
The logs pipeline is the foundation of the Observability & Ops block. Without it, Zero Trust is prevention-only — attackers try every vector and you don’t see the pattern.
Production recipe:
- Logpush → R2 data lake, 1 year.
- SIEM ingest: blocks + audit + high-value signals.
- Cross-layer correlation is the superpower — join UserID across datasets.
- Retention tiered: hot/warm/cold, aligned with compliance.
- Cost control: filter at the source, don’t ship everything to the SIEM.
One line to remember:
Logs aren’t data — they’re proof of control. Without cross-layer correlation, Zero Trust is zero visibility.
Part 15 switches to DEX — Digital Experience Monitoring: measuring latency, WARP health, and app reachability from the end user’s perspective, to spot issues before the helpdesk ticket arrives.
References
- Logpush overview
- Logpush dataset schemas
- Zero Trust log datasets
- Logpush to R2
- Microsoft Sentinel Cloudflare connector
- Splunk Cloudflare app
In this series: